
Gerrymandering has been a political issue for over a century in the United States. It is the intentional drawing of oddly shapes congressional districts to favor one party over another. In the past I have explained it to my students by describing the voting districts as making as much sense as a paintball splatter.
Gerrymandering can be used to create a super majority for one political party over the other despite only having a small majority. If done correctly, it can even create a majority for a party that has a small minority. Although using the term “correctly” to describe something that intentionally deceives seems wrong in itself. The bottom line is that it does not create a true representation of the real voting patterns of the American public.
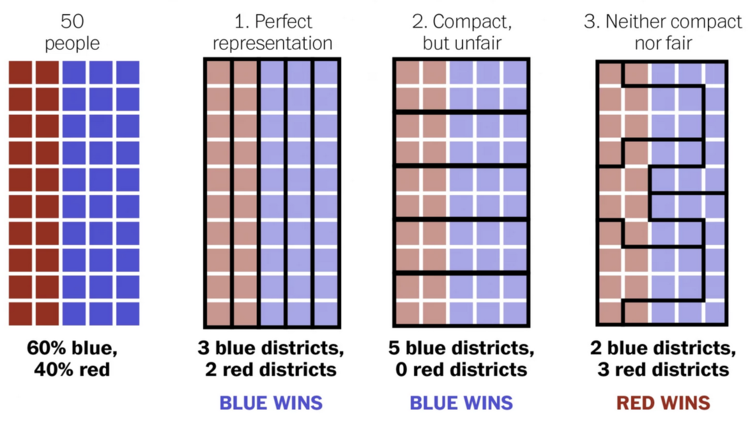
Recently a Facebook user named “Steven Nass” created a chart that made gerrymandering easier to understand than any other visual I have ever come across. He titled it “How to Steal an Election.” The Washington Post adapted it to show the different ways to skew election results. Below you will find a link to the Washington Post’s article with the diagram as well as a detailed explanation.
Gerrymandering is a topic that has come up numerous times on the AP® Human Geography Exam. This past year it was even made into a full blown free response question. For many students taking the exam understanding gerrymandering was the difference between passing and failing the AP® Human Geography Exam.